— by Rebecca Bennett —
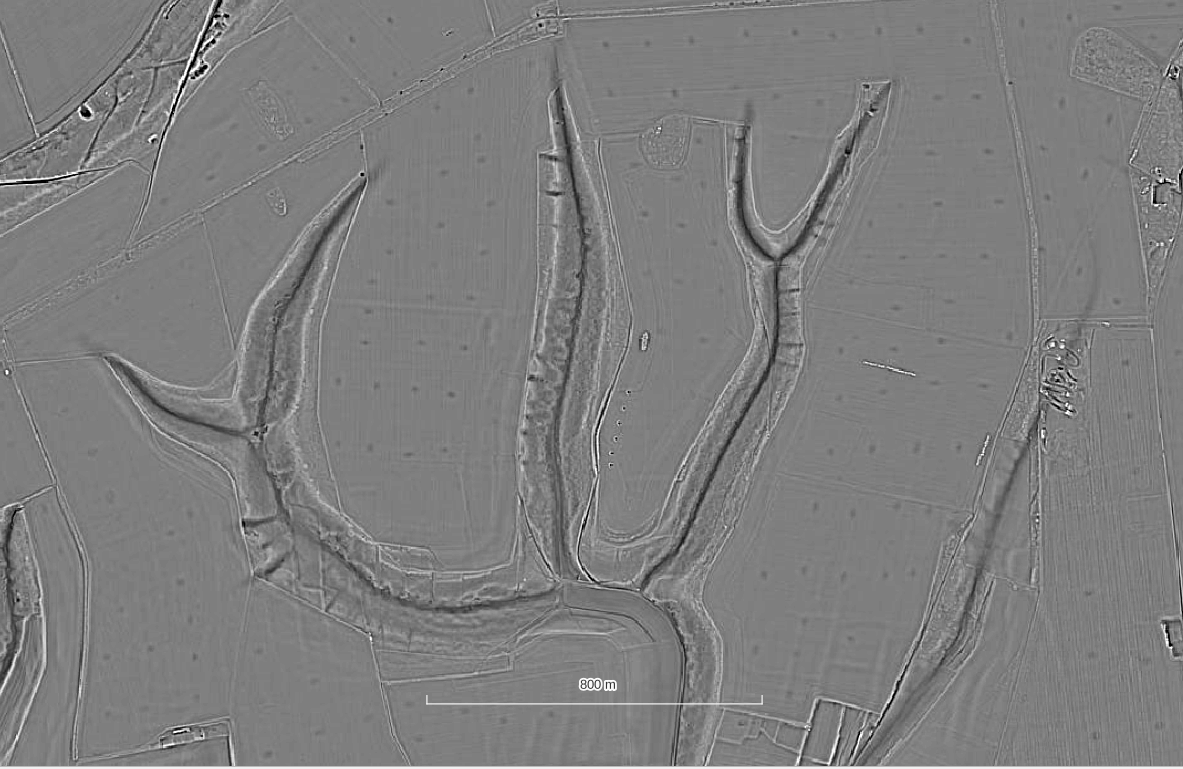
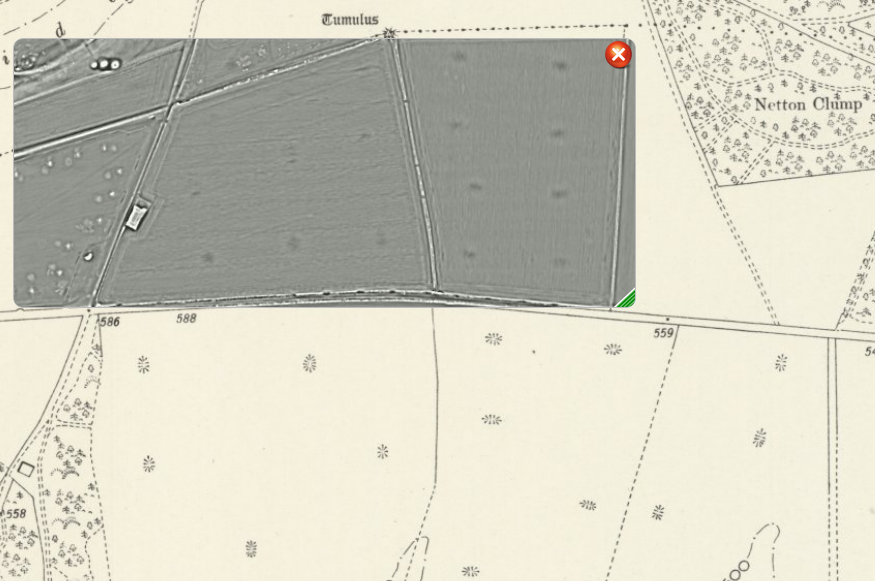
As part of the lidar mapping project and field visits, a very large number of regularly spaced pits have been noticed across the Chase & Chalke project area.
While pits are a common feature of the chalk downlands of southern England, the quantity and distribution of pits in the Cranborne Chase area is demonstrably different to those in similar environments. The origin of these features is unclear and so to understand them better, and separate their mapping from that of other, less numerous features, we created a simple map to quickly capture their distribution. This allowed us to compare them to other data sources including the surface and bedrock geology, topography, historic land ownership and field boundaries. By collecting simple attributes we were also able to identify any sub-categories that may help us distinguish form and function.
Military or Agricultural?
The pits are one of the most noticable features in the LiDAR data and after much discussion with experts in aerial mapping and local archaeology, the group proposed two possible theories as to the origins of the pits:
- anti-landing defences (20th century)
- agricultural practice of liming / marling (18th and 19th centuries)
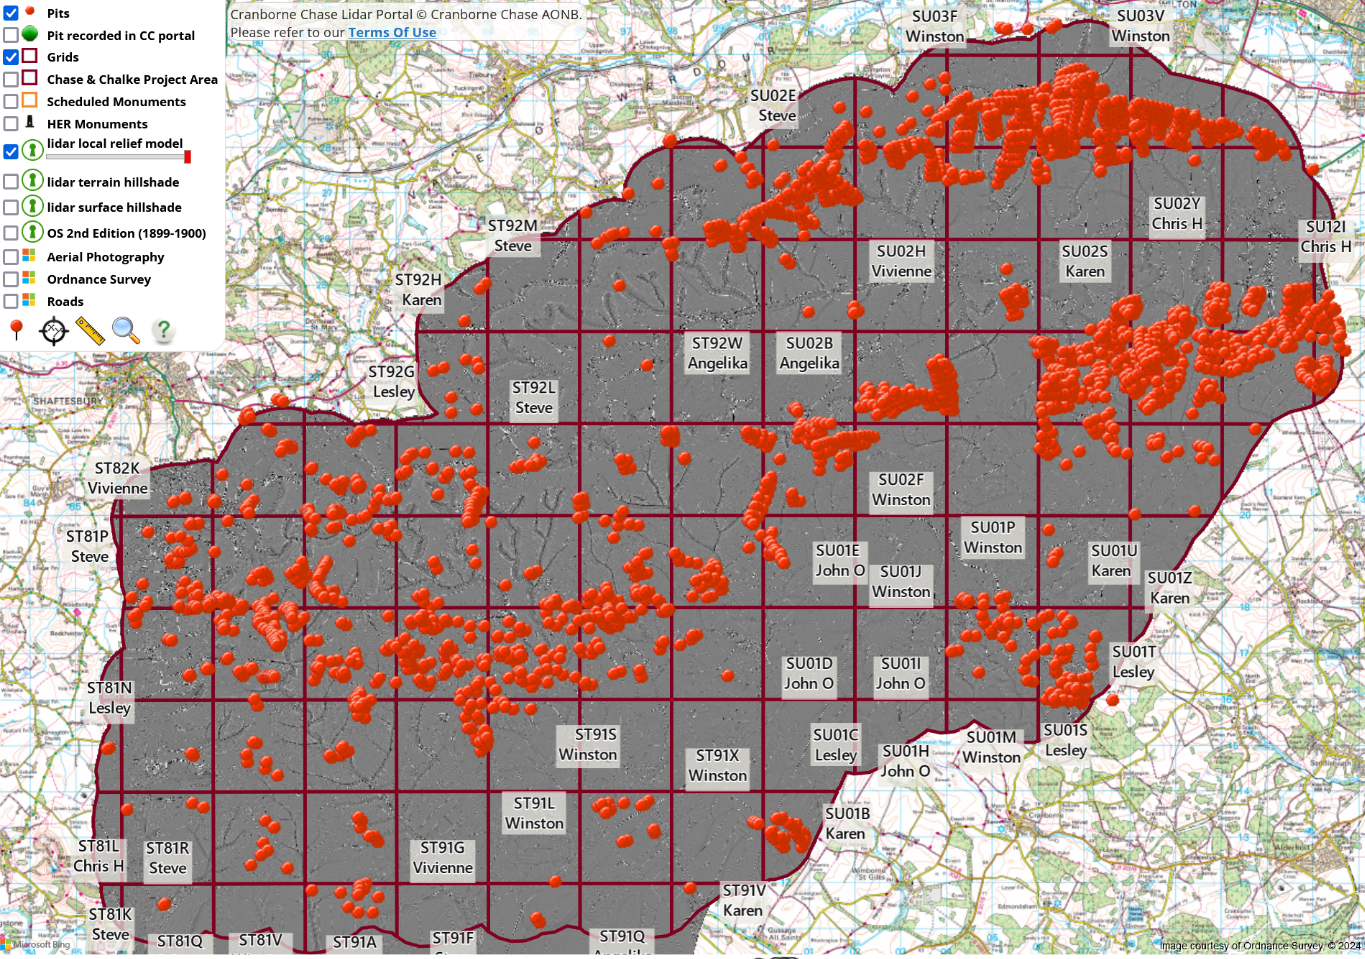
In February 2024 a group of 10 volunteers began a project to map the pits and in doing so hopefully discover more about their origins. The LiDAR coverage was split into 2km grids and pits were mapped as individual points but also as groups collated by field.
Results
In less than two months the volunteers had mapped 2591 pits (in 1091 groupings). These were all reviewed by the project lead, Rebecca Bennett who then undertook some additional GIS analysis which was presented back to the group in April 2024.
The regular grids of pits were observed as strongly regular to the north east of the Chase Chalke area, less to the south west. The observed clustering is statistically significant (NNI 0.46 Z score or -51.02), showing that the pattern of pits is not random.
Geology
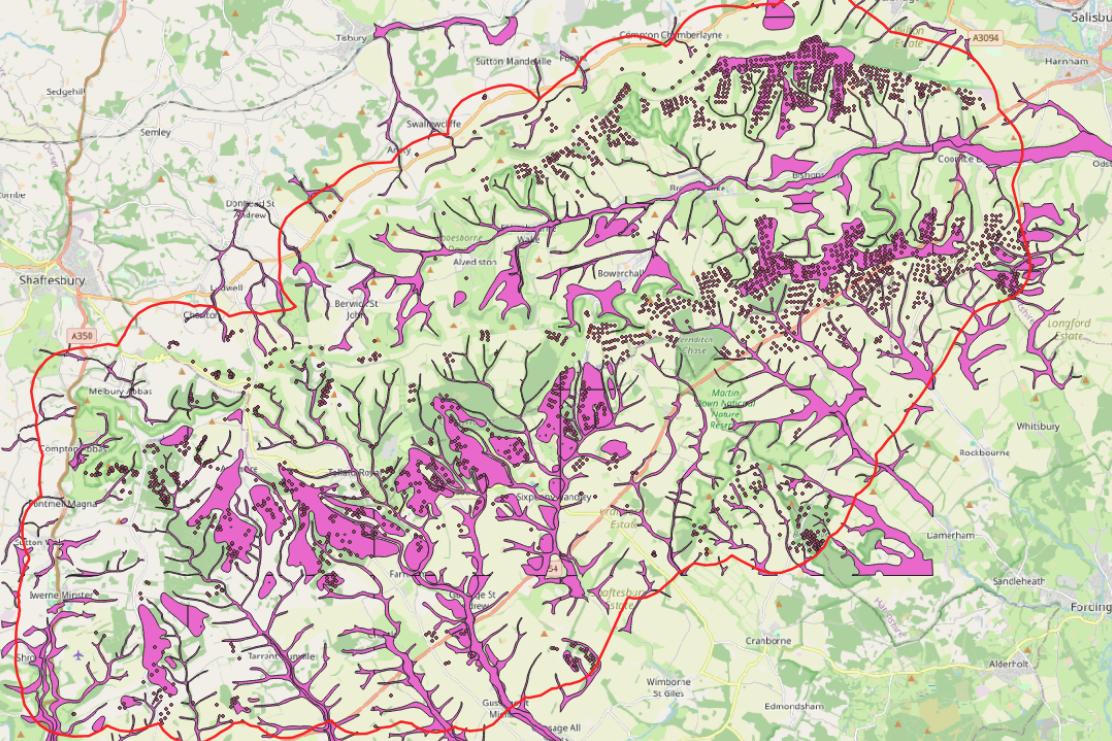
One key area for investigation regarding the purpose of the pits was their correlation with the surface geology. The team was very kindly granted access to the BGS 1:10,000 scale mapping and it was calculated that 90% of the pits mapped were on the chalk geology with just 27% on superficial deposits of clay / silt. This indicates that the material being targeted for extraction was chalk.
Historic Maps
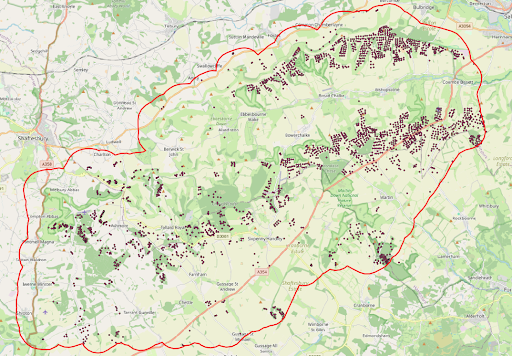
Pits are not mapped consistently as individual features on historic mapping so analysis was undertaken at group level. 11% of groups of pits (roughly representing fields) had one or more pits marked on the historic map.
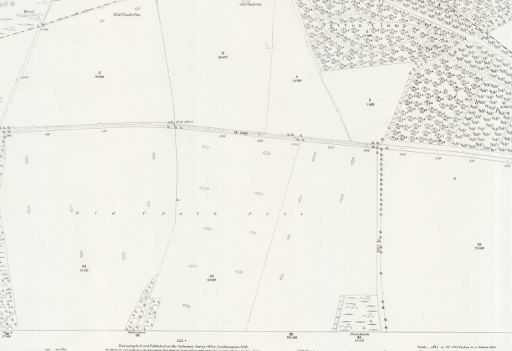
Pits are not mapped on the tithe maps but may be referred to in the apportionments (which have not yet been considered for this project).
Other types of pit
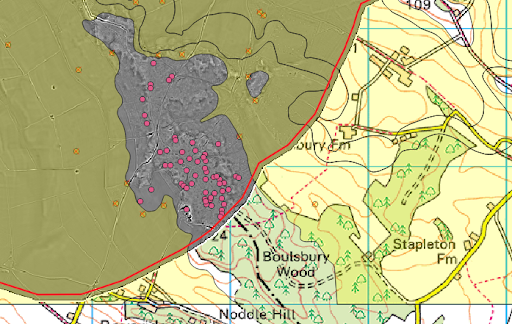
The total mapping exercise also highlighted other sorts of pits like this group of 58 pits in Boulsbury Wood on the edge of the LiDAR coverage. Lying in an area of gravelly sand they are likely to represent quarrying activity.
Conclusions
The total mapping exercise allowed us to demonstrate the quantity, density and correlation of the pits in the Chase and Chalke project area. The evidence strongly indicates an agricultural origin in the 18th or early 19th centuries as they correlate with pits of this form and pattern that are marked as old by the 1st edition Ordnance Survey maps. Although seemingly mundane, there has very little archaeological investigation of these features, their origin, use and disuse and their regular grid form appears to be distinctive to the area.
The next steps for investigating the features could include research in the Wilton Estate Archive and possibly excavation of some of the features.
Huge thanks to Angelika, Chris H, John O, Karen, Lesley, Steve G, Vivienne, Winston, Yvonne and Alan for their hard work mapping the pit location and the subsequent research they have undertaken into the pits.