— by John Mullin —
LiDAR provides us with a new way of seeing history on the ground, often in areas of woodland or scrub where traditional methods of surveying would have been thwarted. LiDAR surveys can provide new insights into existing known features such as banks and ditches, and will often reveal new features, ploughed out mounds and in-filled pits for instance, even in well surveyed landscapes. Most features have standard characteristics that make basic identification fairly routine but in every survey, a number of features will be found that defy simple identification. Some detective work is then needed to work out what the LiDAR has discovered.
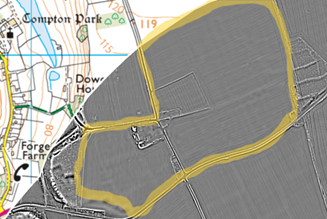
The highlighted area in the picture to the left shows, the LiDAR view of the fields to the east and west of Naishes Farm near Compton Chamberlayne. Each field is showing, faintly but distinctly, a lot of straight lines, typically intersecting at right angles. This would be indicative of modern structures, but what types of structures would fill two fairly large fields such as these?
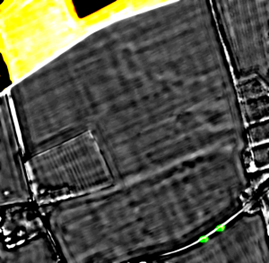
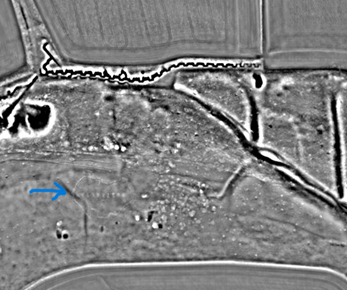
Volunteer Richard Ward, used image enhancement software to produce an image of the fields with a higher contrast than the LiDAR visualisation of the whole landscape. The right hand (eastern) field in the picture below shows a high density of modern boundary lines in the lower half of the field, but also a small number of ancient tracks or field boundaries in the upper right hand side of the field. These connect with the much more visible ancient field boundaries in the wooded area to the right of the picture. Conversion to woodland has protected these ancient field boundaries from being ploughed out.
The search was now on for additional information that could help identify the features found in the Naishes farm fields. Quite often crop mark photos can tell a story about a feature and Google Earth Pro is an excellent free source of these photos from different years, in this case giving the picture below from 2005.
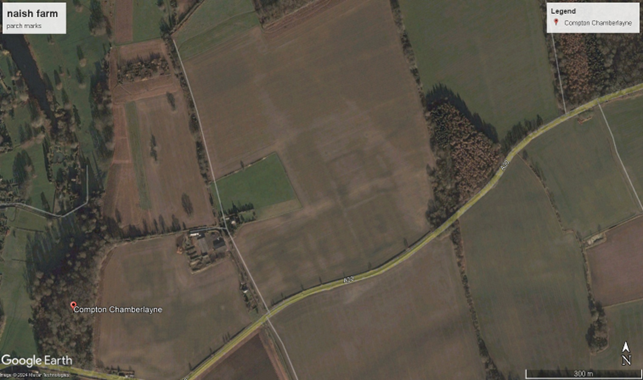
The crop mark photo confirmed the detail in the right hand field but added new rounded areas to the features in the left hand field.
The next step was to find out if there had been any previous historic features located in these fields. Naishes farm is in Wiltshire and the authoritative source for archaeological data in Wiltshire is the Wiltshire Historic Environment Record Search portal. This is where we began to make real progress. Using the portal we located Historic Environment Records (HERs) covering a WW1 Army bayonet practice range in the top half of the right hand field and three records of aerial photographs that showed features in the lower halves of the left and right fields.
Existing Studies
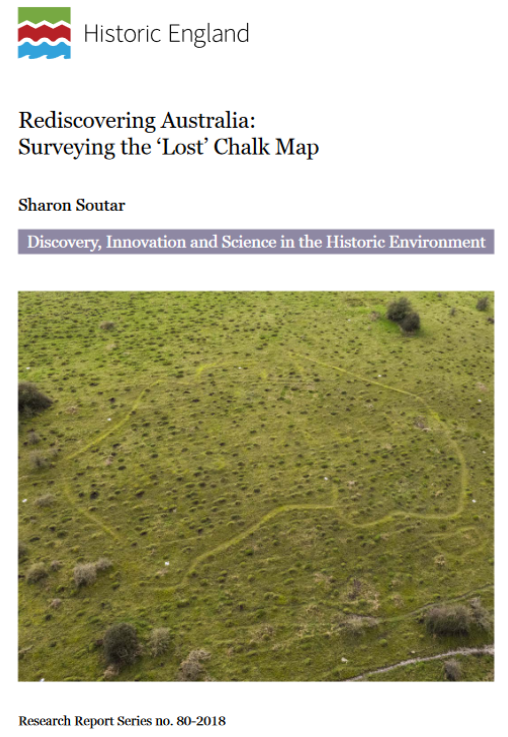
Serendipity played a part in resolving the mystery of these fields. In 2017 and 2018 Historic England developed a research report, based on ground and aerial survey, of the Australia Map located on a hillside near Compton Chamberlayne. The report, titled ‘Rediscovering Australia – Surveying the ‘Lost’ Chalk Map’ included a detailed aerial survey of an area 4km2 around the map, and this small area included the fields at Naishes Farm. The history and geology of the Compton Chamberlayne area were covered in depth in the report, and in particular there was extensive coverage of the temporary Army camps that were located in the area during WW1. These housed the soldiers, often from Australia and New Zealand, who carved the map and a set of Army badges into the chalk.
The interpretation to the right (figure 19 from the Historic England report) shows 13 main Army camps and a number of related camps between Sutton Mandeville and Barford St Martin that housed up to 20,000 men. The Camps at Naishes Farm, camps 5,6 and 7, were hospitals and recuperation centres for injured troops after 1916. The camps were indeed temporary and had run down by 1919 with huts and fixtures being sold off in 1920.
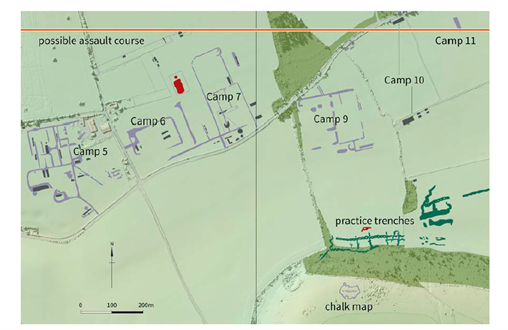
The aerial survey enabled a fine grain view of camps 5,6 and 7 to be produced for the Australia Report. It was these camps that we had captured in our LiDAR survey.
The second image to the right (Figure 21 from the Historic England Report) shows camps 5,6 and 7 in some detail. Thousands of men were cared for and rehabilitated in these camps. If fit they were sent back to France, to the trenches. If not they were sent home to Australia and New Zealand.
Local history groups have built up a solid understanding of the WW1 camps in the Nadder Valley over the years using written records, historic photographs, artefacts and memories from local people. The Historic England report has generated and consolidated historic, geological and archaeological data and understanding to build on that original research. Finally the Chalke and Chase LiDAR Project has captured detailed views of the camps and of associated firing ranges and practice trenches to add to the existing knowledge.
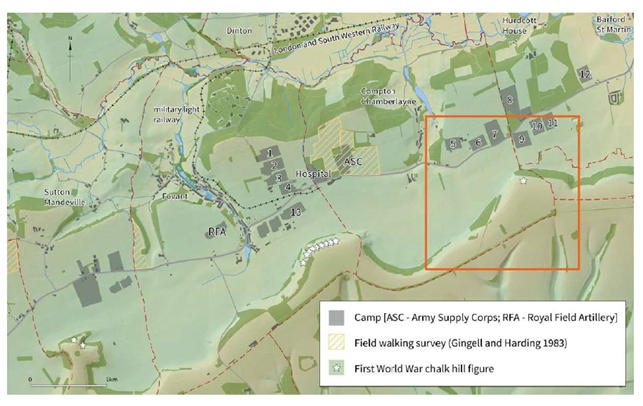
OS data © Crown copyright and database right 2019.
The image to the left shows the Australia map (highlighted) on a ridge with a WW1 practice trench in front at the foot of the ridge. The camps had a massive impact on this area in WW1. Up to 20,00 men were living, training and recuperating in the area at any one time. A vast support infrastructure was required, including a light railway. Life in the area, especially farming, was significantly disrupted. It is only just over 100 years since all this happened and yet now we have only the Australia Map, the Fovant badges, a short section of practice trench and some museum artefacts to offer evidence of this historical period. It is something of a paradox that the most recent history we have captured in this project is also the most ephemeral and likely to disappear.
Conclusions
The LiDAR project has captured data on over 1200 features across Cranborne Chase covering 5000 years of history from the Bronze Age onwards. With knowledge we can turn that data into information about the features. Information about the purpose of the features and about the people who built them. And ultimately that is what we have captured – 5000 years of life on the Chase.
Acknowledgements:
Richard Ward: additional LiDAR image processing
Google Earth Pro timeline of historic aerial imagery
Historic England Aerial Investigation team