In the Cranborne Chase portal we have provided access to the 2nd Edition Ordnance Survey mapping which dates from the turn of the twentieth century (surveyed in 1900, published in 1902). The historic mapping provides essential context to the lidar data and satellite imagery, allowing more confident identification of features of interest. In the example below we look at how the historic mapping can help to make sense of features in the lidar.
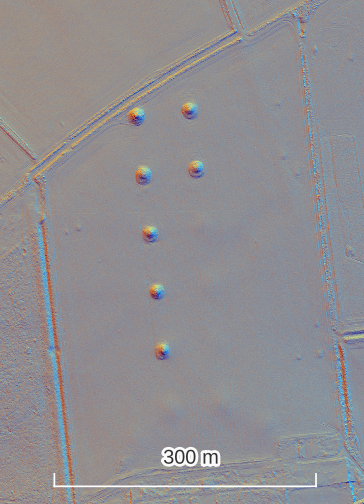
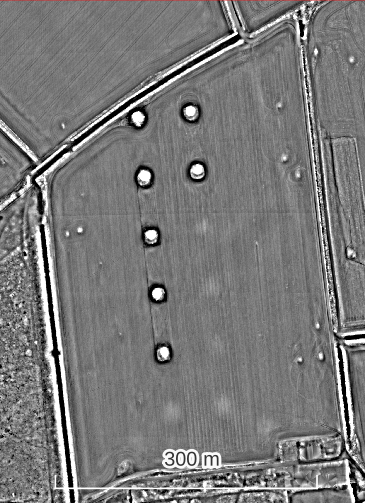
In the hillshade model we see a series of 7 mounds, c20m in diameter. They appear on a regular grid pattern, are prominent and well formed. On first assumption these read as modern features. However in the LRM model we see that the grid extends with a further 5 features, much less prominent but on the same grid and of the same size and scale as the mounds that first drew our attention to the area.
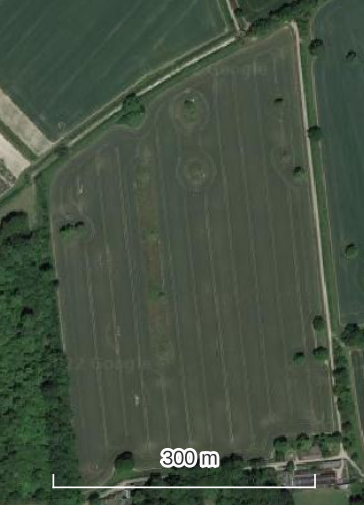
The satellite image shows that the area is under an arable regime. The 7 prominent mounds are respected by the plough lines, the 5 more subtle mounds are not (perhaps explaining why their form is different). The image holds no further clues as to the nature of these mounds but the fact they are not equally respected / damaged by agricultural activity indicates that they don’t perhaps relate to the most recent land use.
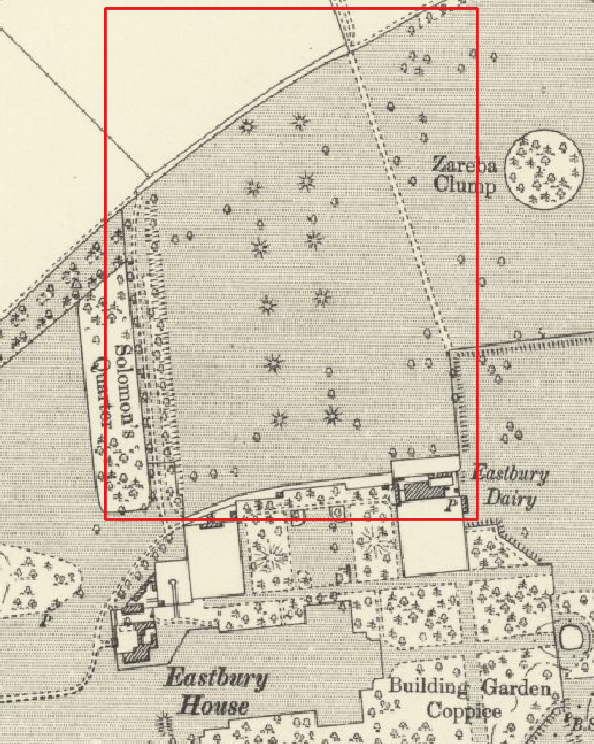
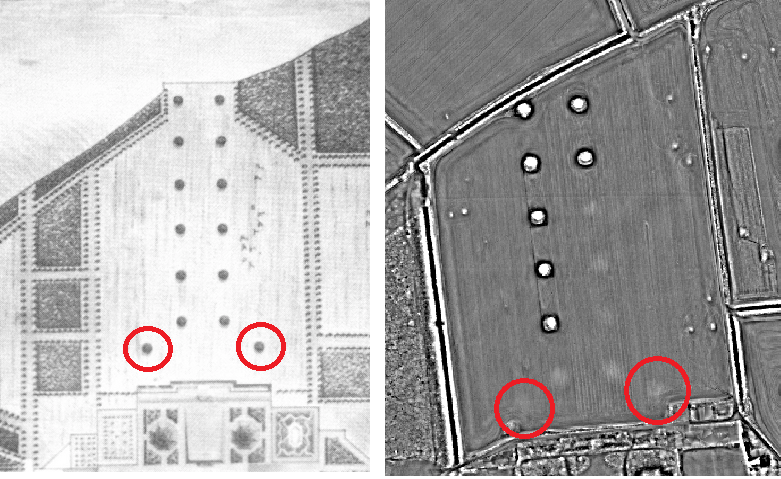
Looking at the historic mapping we can see that this now agricultural field was once in the immediate vicinity of Eastbury House.
We can also see that 11 of the mounds are marked on the map with hachures.
This adds the possibility of the mounds being part of a designed landscape to our interpretation.
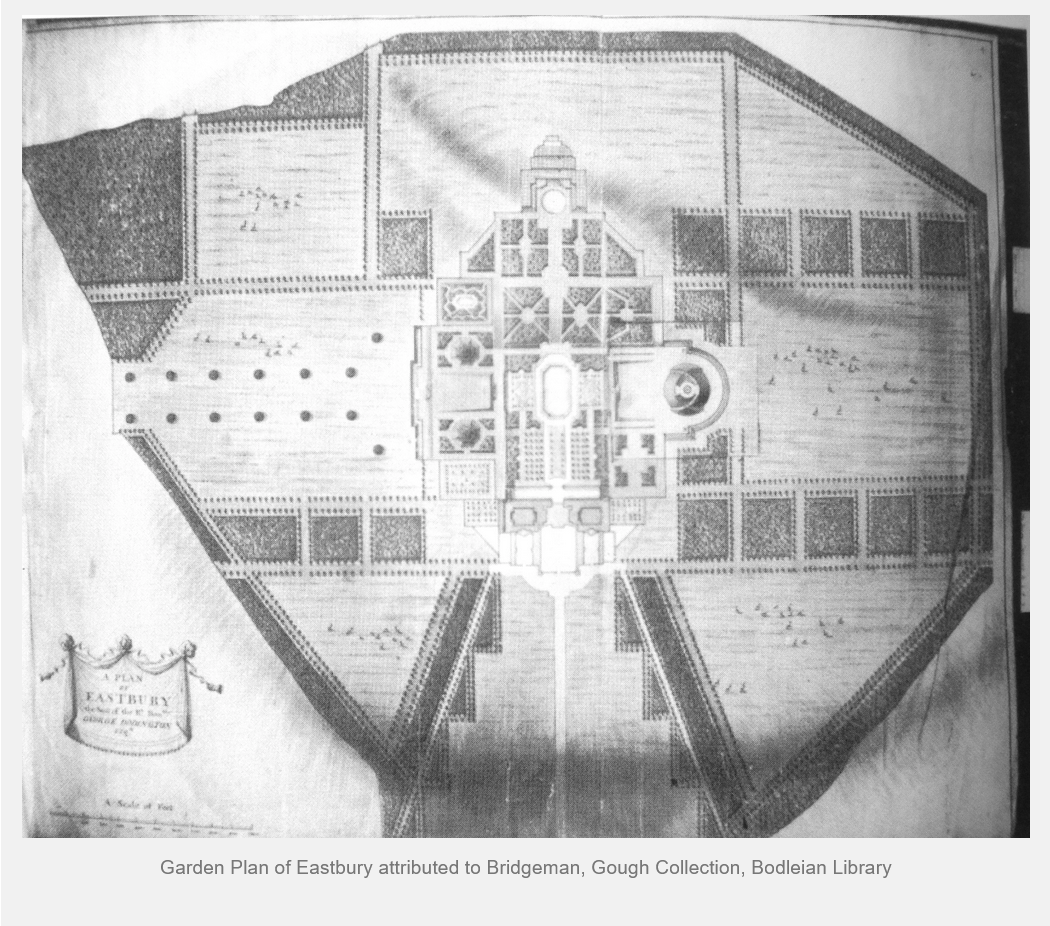
In this case a quick google search appears to confirm our interpretation…
Finally, comparing the historic map to the LRM visualisation allows us to identify a further two potential mounds.