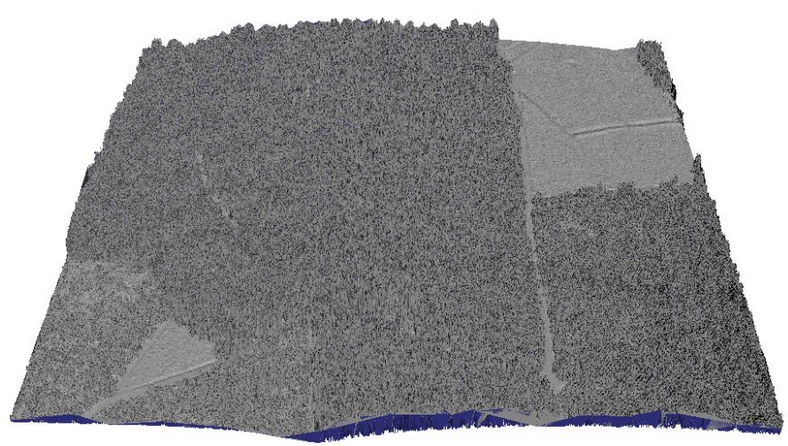
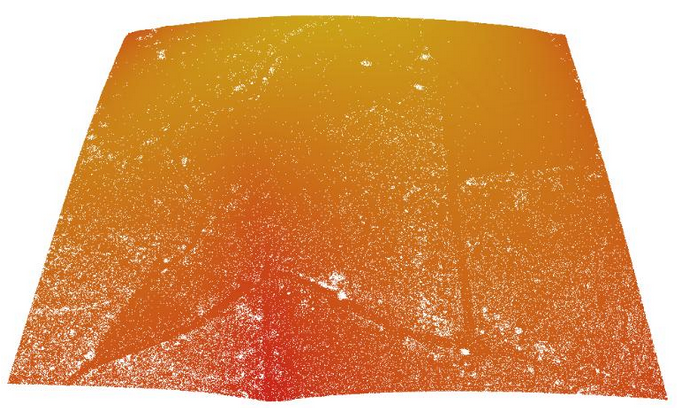
Point clouds of lidar data are not very intuitive if you are trying to discover and map archaeological features. The human eye and brain is best at interpreting surfaces and so we process the lidar into two continuous models, one that represents the landscape with all features and one that represents just the ground.
These models are known as the DSM (digital surface model) and DTM (digital terrain model). The DSM contains vegetation, buildings and other man-made structures. The DTM is a model of the landscape without vegetation or buildings.

The DTM is the most useful resource for archaeologists as we are interested in mapping the lumps and bumps of the ground surface that relate to traces of past human activity. However the DSM provides contextual information that helps us to interpret the landscape and features within it. Both are available to view in the Cranborne Chase portal.
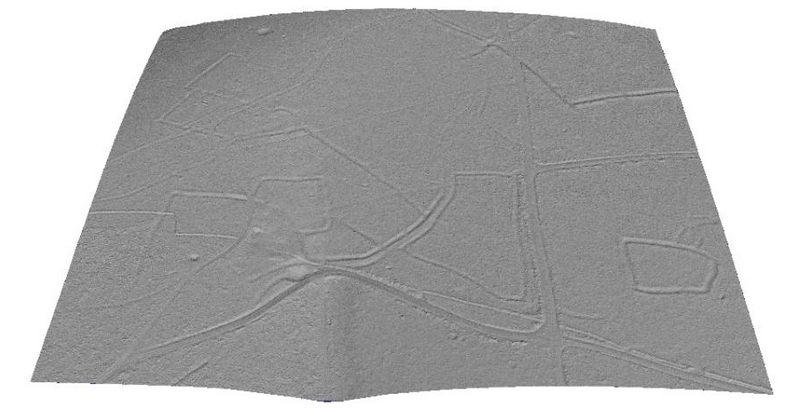
Looking for Microtopography
As a final processing step to highlight the small scale changes in the DTM that represent potential archaeological features, we process the DTM into two visualisations, a multi direction hill shade model and a local relief model. Comparing these two models allows us to identify features of interest quickly and accurately.
There are many different ways to visualise lidar data to view archaeological features. If you want to find out more you can check out the resources page at the end of the course which has links to other examples and publications.