When an archaeologist looks at the lidar models they are most interested in the small lumps and bumps, the microtopography. It is tricky to see small scale changes in the surface by looking at the DTM, as these tend to be overwhelmed by the macrotopography, (the large scale changes in height that represent bigger landscape features like hills, valleys, coombes, ridges etc).
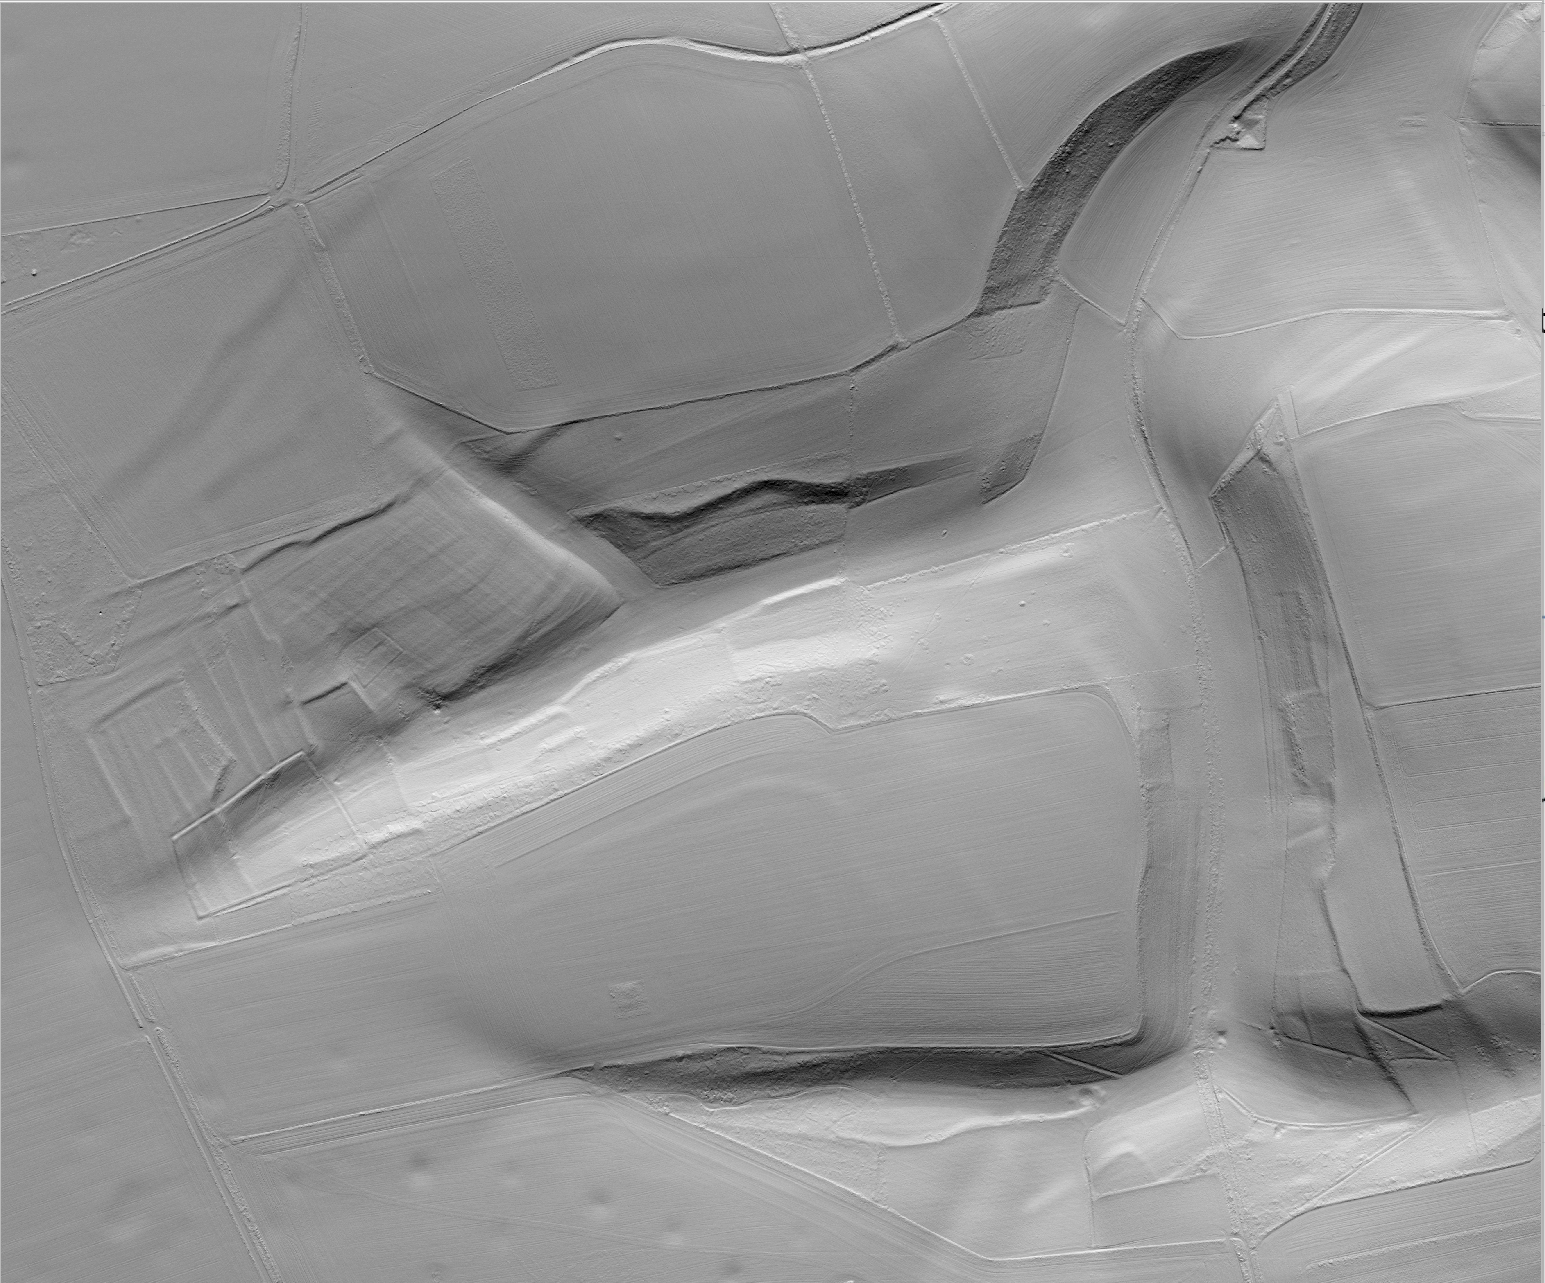
The image below show the same area of earthworks near Knighton Hill in the original DTM model (left) and a specialist visualisation (right).
To highlight the small scale changes in the Cranborne Chase lidar DTM that represent potential archaeological features, we have processed it into two visualisations: a multi direction hillshade model and a local relief model. Comparing these two visualisations allows us to identify features of interest quickly and accurately.
Visualisation 1 – Hillshading
The hillshade is the most common visualisation of lidar data. If you have seen a published picture of lidar data it is almost guaranteed to be a hillshade! This is because the hillshade is designed to be intuitive and representative of a “naturalistic” view of the landscape. Hillshades help users to situate themselves in the landscape and make sense of the topography.
Because the direction of the hillshade affects what can be seen, we need to consider multiple directions. When we do this the light plays tricks on our brain we see odd behaviours like features changing from banks to ditches, depending on the light direction.
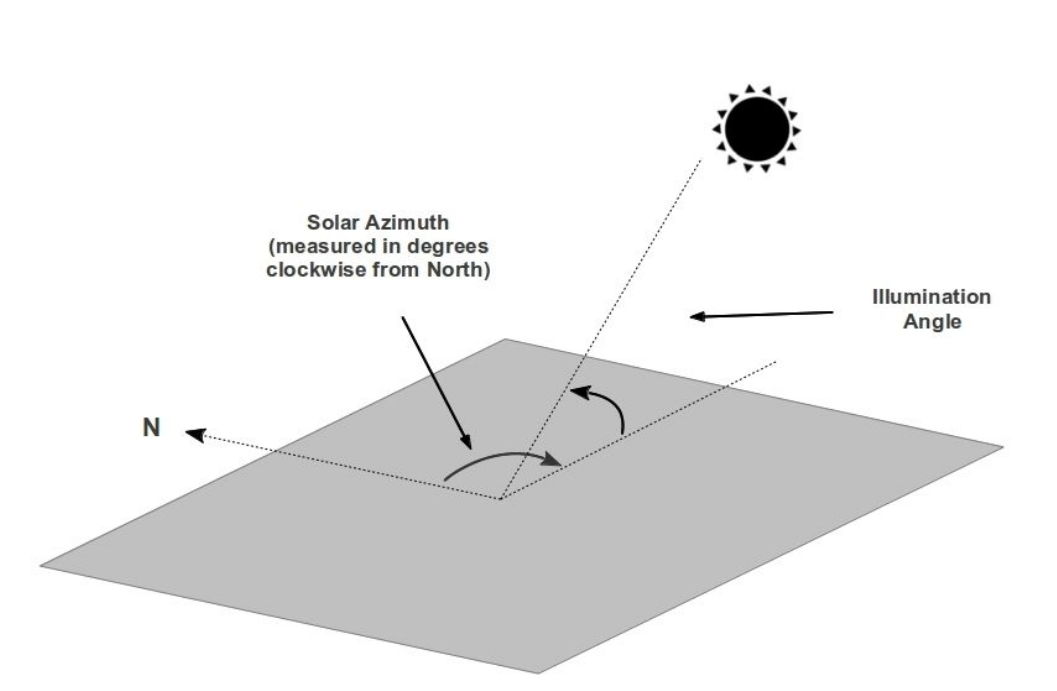
Hillshade visualisations are created by modelling the impact of different directions of sunlight (solar azimuths) on the DTM. They highlight microtopography only if it is perpendicular (at right angles) to the direction of sunlight such that it casts a shadow.
Watch the animation below to see what a difference the direction of light makes to the presence / absence and form of features in this landscape

The solution: Multi-direction Hillshade
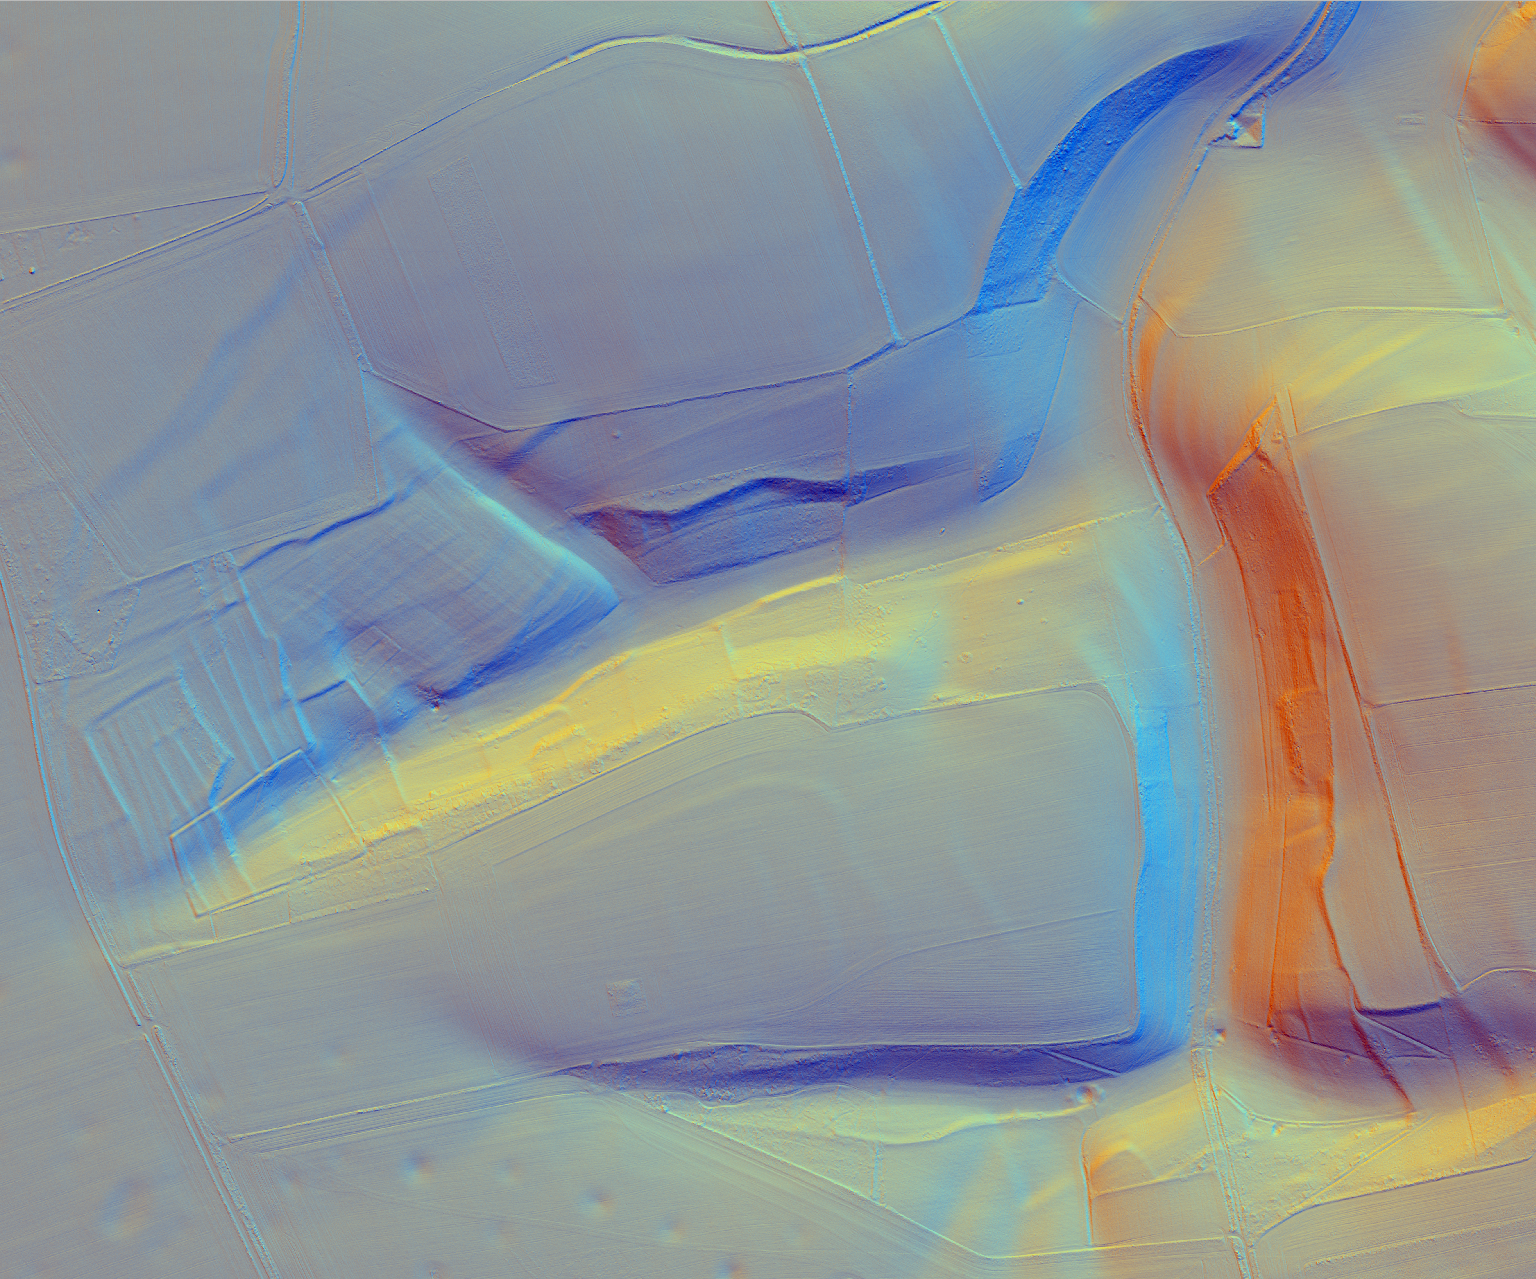
For the portal we have created a multi-direction hillshade visualisation that combines three sun directions to make a colour image.
Red = 315°
Green = 22.5°
Blue =90°